What Is Statistics Really About?
I am teaching Introduction to Statistical Reasoning this fall, and while preparing for the course I found myself returning to a basic question: what is statistics really about?
I have taught statistics for many years, and like most of us, I have often explained why statistics is useful. We use it to analyze data, quantify uncertainty, make predictions, compare groups, test scientific hypotheses, evaluate interventions, and make decisions. But I am not sure I have spent enough time explaining what statistics is as a scientific discipline, or what statisticians actually study.
We often say that statistics is the science of learning from data, or of making sense of data. I like that description, but lately I have wondered whether it places too much emphasis on the data themselves.
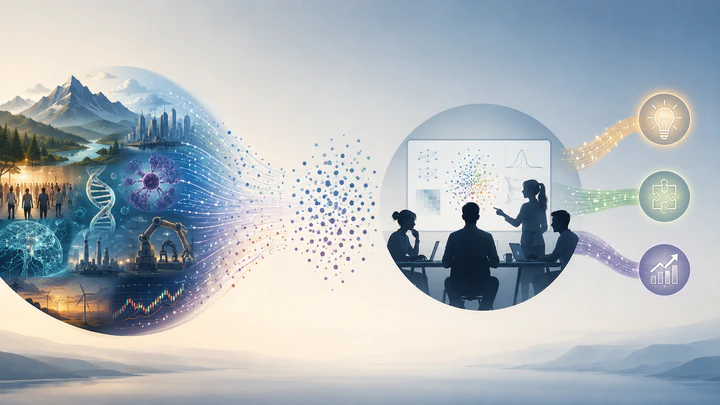
When a statistician looks at a dataset, the dataset is rarely the final object of interest. We look at the data because we believe that something produced them. A biological process produces measurements. A disease process produces survival times. Human behavior produces transactions. A social process produces a network. A spatial process produces a pattern of events on a map. A dynamic system produces a time series. An AI system or large language model produces text, embeddings, or predictions. The observations in front of us are one realization of something larger.
That makes me think that statistics may be better understood not simply as the science of data, but as the science of reasoning from data about the systems that generate them, as our NASEM report frames it: transforming raw data into actionable wisdom.
Suppose, for example, I show you the locations of hundreds of trees of different species across a tropical forest. We can certainly summarize those locations and make a visualization. But the interesting questions quickly move beyond the points themselves. How are different species distributed across the landscape? Are some species clustered while others are more scattered than we would expect by chance? Does the spatial pattern vary with soil, elevation, moisture, or topography? How are these patterns associated with the impacts of hurricanes, such as wind damage, canopy opening, and changes in recruitment or survival? My research with Maria Uriarte is built around exactly these questions: how do ecological processes and climate disturbances jointly shape the distribution of species and the structure of forests over time?
The dataset is the evidence. The underlying system is what we are trying to understand. Statistical reasoning is the bridge between the two. The reason this bridge is needed is that the connection between the system and what we observe is rarely deterministic. Systems carry randomness: measurements have noise, samples vary, events occur at uncertain times, biological systems fluctuate, environments change, and many aspects of the world remain only partially observed. Statistical reasoning is therefore reasoning in the presence of variation and uncertainty. Probability theory gives us one of the main languages for describing that uncertainty, which is why it sits so close to the foundations of statistics.
This suggests a formulation that I increasingly like: the distinctive subject of statistical study is the stochastic data-generating mechanism and what can be learned about it from finite observations.
I do not mean that every statistical analysis must begin by writing down a literal probabilistic model for the mechanism. Leo Breiman’s influential paper, Statistical Modeling: The Two Cultures, distinguished between a culture that tries to represent the data-generating mechanism with a stochastic model and an algorithmic culture that treats the mechanism as largely unknown and focuses instead on prediction. The two cultures share a common premise: the observed data have been generated by some process. One approach tries to represent that process directly; the other argues that the mechanism may be too complicated to model well, and so focuses on learning useful relationships between inputs and outputs. The disagreement is about how to learn from the mechanism, not about whether the mechanism exists.
This framing also helps make sense of the extraordinary range of work that statisticians do. Some of us analyze and visualize data. Some develop new models, methods, and algorithms. Some build computational tools that make those methods usable. Some work closely with scientists, engineers, physicians, policymakers, or companies to solve substantive problems. Some develop theory, using probability, mathematics, and computation to understand why methods work, under what assumptions they work, how much information is available in finite samples, what can be identified, how quickly procedures learn, and what happens when assumptions fail. These can look like very different kinds of work, but they are all connected with the same underlying question: how can we reason reliably from what we observe to what we want to know?
This perspective also makes clear why we care so deeply about problem framing, data preparation, data cleaning, data types, data quality, uncertainty quantification, and causal inference. These are not separate technicalities. They are all ways of asking whether what we derive from data is a rigorous characterization of the underlying system, or whether our conclusions are being driven by artifacts, selection, noise, or confounding. Experimental design, survey sampling, measurement, missing-data mechanisms, and causal inference all remind us that the way observations come into existence is part of the statistical problem. John Tukey made a related argument in his classic 1962 paper The Future of Data Analysis, where he argued for data analysis as a broad empirical discipline rather than merely an application of mathematical statistics. I think the idea can be pushed further: statistics is concerned with the entire intellectual path from systems to observations, from observations to uncertainty, and from uncertainty to conclusions.
As AI can increasingly perform many of the operations of statistical practice—summarizing datasets, generating visualizations, fitting standard models, writing code, and suggesting interpretations—what becomes more important for statisticians to do?
The deepest statistical questions were never procedural. What generated these observations? What exactly are we trying to learn? Which assumptions make that learning possible? What is not identifiable from the data we have? Would different data resolve the ambiguity? Which sources of variation contributed to the findings? To what extent can we trust a conclusion? What would have happened under a different intervention? And when an AI system gives us an answer, what makes that answer statistically defensible?
All of this has made me rethink how I want to begin an introductory statistics course. We often start with variables, histograms, and rules of probability. Those things matter, and students need to learn them. But perhaps the first question should be more fundamental: what are statisticians trying to understand?
I want students to see that statistics is not just a toolbox. It is a way of thinking about evidence, uncertainty, and systems we can observe only incompletely. I also want to show them, in an accessible way, the questions that motivated my own research and the role of statistical reasoning in bridging what we can observe to what we want to know.
Our students deserve to see statistics as an intellectual discipline, not just a set of methods to master: how to learn about an uncertain world from limited observations.
So, for now, the definition I am carrying into the classroom is this:
Statistics is the science of reasoning from finite observations about the stochastic systems that generated them.
Or, more simply:
Data are what we see. Statistics helps us reason about what is going on behind them.
I suspect I will keep revising that definition. That may be exactly the point.